
PSP
ULTRASONOGRAPHY AND MR IMAGING IN PROGRESSIVE SUPRANUCLEAR PALSY
William Liboni1, Piero Pignatta1, Elisabetta Salzedo1, Sara Giordano2, and Filippo Molinari3 1 Neurology Division, Gradenigo Hospital, Torino, Italy. 2 Clinical Engineering, Gradenigo Hospital, Torino, Italy. 3 Biolab, Dept. of Electronics, Politecnico di Torino, Torino, Italy.
INTRODUCTION
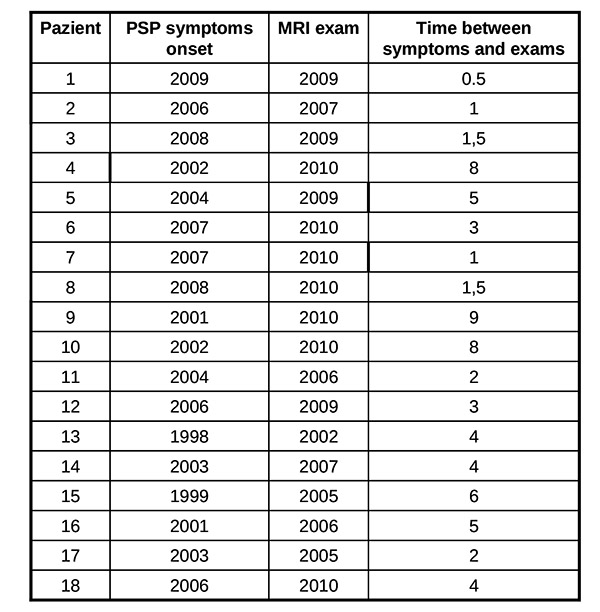
Progressive Supranuclear Palsy (PSP) also known as Steele, Richardson and Olszewski disorder (Steele et al 1964-Litvan et al 1996-Golbe et al 1988-Nath et al 2003) is a neurodegenerative brain disease that has no known cause, treatment or cure. PSP has no known geographical, occupational, racial preference; it affects brain cells that control walking, balance, mobility, vision, speech, swallowing. Symptoms begin on average when an individual is in the early 60s, but may start as early as in the 40s: a good history and physical examination support the clinical diagnosis and latency of each features makes us suspect a probable PSP, an atypical parkinsonism. The diagnosis of a large number of cases of PSP is missed or delayed: 75% of the patients are ever clinically diagnosed by neurologist and in most cases the median interval between onset and diagnosis is 3 years. Notwithstanding such differences in clinical presentation, there remains an overlap in symptoms making the differential diagnosis between such neurodegenerative disorders challenging. A few imaging techniques developed to evaluate brain anatomy and function are used extensively to improve the diagnostic accuracy of different forms of Parkinsonism. Non invasive and safe methods can now document brain structures. Transcranial sonography (TCS) is a very low cost tool to assess basal ganglia and mesencephalic echogenicity ( Berg et al 1999-Walter et al 2007). Conventional magnetic resonance imaging (MRI), is a valuable tool for the exclusion of secondary parkinsonism. Our purpose is to define characteristic objectively measured imaging markers that point out normal biological processes, pathogenic processes in PSP. Such markers should be sufficiently sensitive and specific to show the underlying biological disease and the pharmacological responses to therapy. PATIENTS and METHODS PATIENTS We studied 22 pts with PSP (2 pts with possible PSP – 19 pts with probable PSP –1 pts post mortem confirmed PSP); 3 pts with probable MSA (2 pts MSA C – 1 pt possible MCA P); 13 pts with probable PD; and 16 healthy volunteers. Subjects were age and sex matched. Figure 1 summarizes the demographics of our population. All pts performed TCS, MRI, and DaTSCAN; 2 pts with probable PSP, 1 pt with confirmed PSP, and 1 pt with probable PSP did not perform advanced MRI; all healthy controls underwent TCS and MRI examination. Table 1 shows the age-sex-onset of symptoms-date of MRI examination-time from initial symptoms to MRI evaluation of the pts with PSP. Nine pts were examined less than 3 years after symptoms onset (class 1 – 50%); six between 4 and 6 years after onset (class 2 – 33%), and 3 more than 6 years after onset (class 3 – 17%).
All those who underwent the evaluation are assessed using the Hoehn and Yahr score. The disability was very severe in 1 pt with PSP and 1 pt with MSA – score 5, severe in 3 pts with PSP – score 4, pts characterized by lasting illness over 6 years; the remainder have from 1 to 3.

ULTRASOUND EXAMINATION OF THE BRAIN (TCS)
The ultrasound system HDI 5000 ATL (Advanced Technology Laboratories; Washington USA) equipped with a 2.5 MHz phased-array probe has been used for ultrasound examination. The following ultrasound parameters have been chosen: penetration depth 12-14 cm and contour amplification medium. Image brightness, dynamic range, and time gain compensation have been visually adapted as needed. Investigation was performed transtemporally with the preauricular position of transducer obtaining a 2D – mode image of the brainstem, the basal ganglia (LN – CN) and the ventricles. The mentioned areas have been investigated by tilting the transducer in the axial ICS scanning planes (Walter U et al 2007). The butterfly shaped mesencephalic brainstem identificated in the axial scanning plane parallel to “orbito meatal line”, surrounded by the hyperechogenicity of the basal cisterns, has been displayed in about 95% of subjects at both sides of investigation. The modulations of both echogenicity and size of normal features of the substantia Nigra (SN), Red Nuclei (RN), median brainstem raphe (BR), and the aqueduct (A) assess pathological data. A semiquantitative assessment using a scoring system and planimetric measurements of altered echogenic areas have been performed (Zecca et al. 2005 – Walter et al. 2007).
MRI PROTOCOL
All scanning was carried out with a 1.5 T MR scanner – Philips Medical System Gyroscan NT. Structural conventional images were obtained from axial-sagittal-coronal slices, with 5 mm thickness T1 – T2 weighted with a spin – turbo spin echo (SE-TSE) sequences. Apparent Diffusion Coefficient (ADC) and Fractional Anisotropy (FA) values were calculated in each region-of-interest (ROI) placed on the frontal lobe, LN, SN, MCP, SCP (see fig. 2). DTI- ADC-FA values were obtained by using the publicly available DARTEL software package.
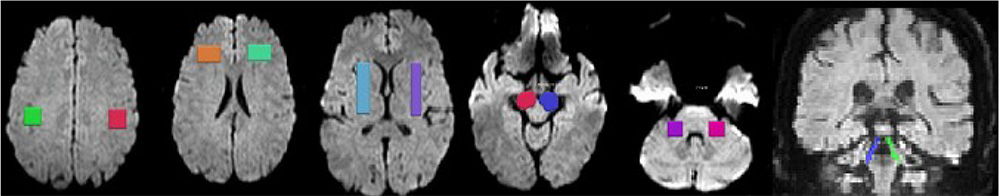
The same ROIs were used for DTI-tractography. The average ADC and FA values of the ROIs pixels computed on T2 weighted axial images were considered as indicative of the region. A sample is depicted by fig. 3.
RESULTS AND DISCUSSION
The TCS pictures of infra and supratentorial brain pictures and corresponding MRI images are showed in Fig 4. In agreement with existing studies and the experience of our team (data presented at the Symposium Neuroradiologicum 2006, Adelaide, Australia) it has been evidenced that there are characteristic changes in hyperechogenicity of SN and LN as well as dilatation if the third ventricle, which can be detected by TCS. The hyperechogenicity of SN and its enlargement was almost always found in idiopathic PD, whereas it is rarely found in APD (about 20% of the 22 pts with PSP and 3 pts with MSA). The LN
hyperechogenicity was found in 80% of APD in clear contrast with LN hyperechogenicity in 16% of the 14 pts with the idiopathic PD fulfilling clinical diagnostic criteria. DATScan (123-I-FP-CIT SPECT) performed in the pts, 18 with PSP-3 with MSA-13 with PD, showed altered state of presynaptic nigrostriatal dopamine neurons but could not discriminate the pts with PD from those with PSP and MSA. Figure 5 summarizes the comparative data between DATScan and TCS. Moderate SN’s hyperechogenicity was detected in about 12% of controls; all subjects had a LN’s regular signal combined with III ventricule’s width, less than 6 mm.
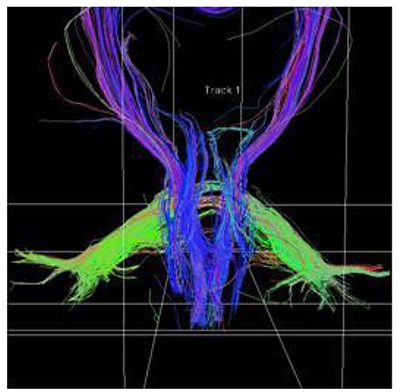 Fig. 3. Sample of DTI-tractography of a PSP patient. Cortico-spinal tract (blue), MCP (green), and SCP (blue) are depicted.
The results for the advanced MR imaging are reported by table 2. There is a significant difference in the scores among controls, PD, and APD. The difference is evident even in pts with early clinical pathological signs that have been detected within the first two years of illness (i.e., class 1). PSP pts have incremented ADC and decreased FA values in LN – SCP and, even in early stage, in frontal lobe with respect to PD (statistically significant, p < 0.05). We have too few MSA pts for obtaining a statistical relevance when compared to PSP. However, our observation is that MCP is more altered in MSA than in PSP and PD.
CONCLUSIONS
On the basis of this pilot study, we consider TCS as an early marker of movement disorders characterized by protein and iron metabolic impairments. TCS cannot, however, indicate prognosis and changes correlated to therapy. ADC-FA-DTI could be a marker of brain tissue pathology in the region that anatomo-pathological and clinical findings recognize as characteristic areas for the different phenotypes of movement disorders. Both the techniques could improve differential diagnosis between PD and APD; particularly PSP.
TCS is a very repeatable and low-cost techniques; MR at 1.5T is relatively diffused and accessible to population and with overall costs compatible with mass screening. Our pilot study demonstrates the possibility of obtaining indicative descriptors of the presence of pathology and its progression in movement disorders.
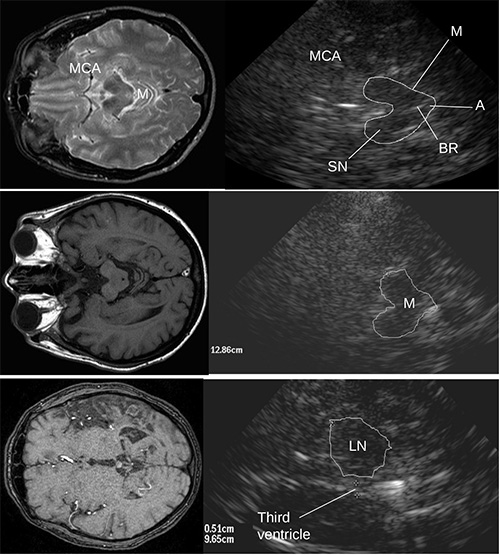
Fig. 4. Correspondence between MRI and TCS anatomical structures.
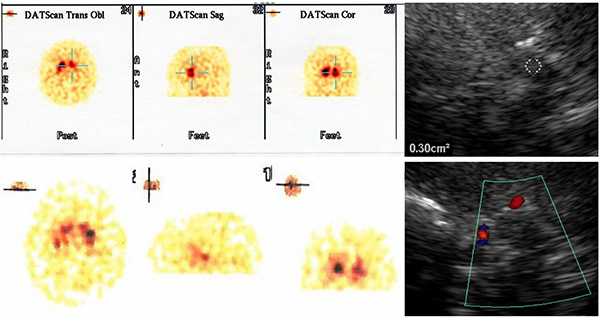
Fig. 5. DATScan (left) and TCS (right) in idiopathic PD patient (top row) with hyperechoic SN and in PSP (bottom row) with almost isoechoic SN.
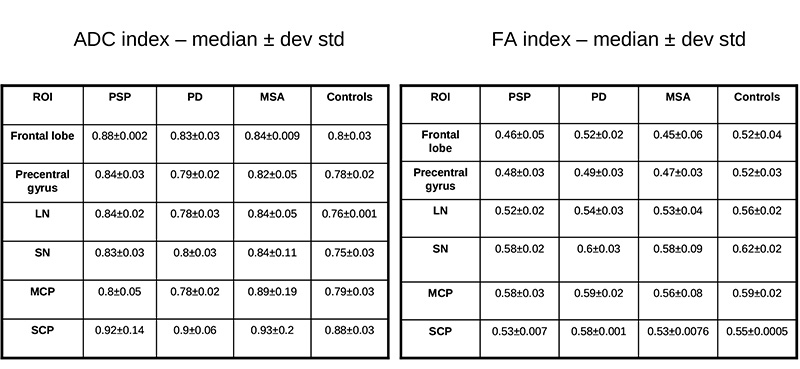
Table 2. ADC (left table) and FA (right table) for our sample population.
SCOPRI GLI ALTRI PROGETTI ATTIVI
